
Trend Analysis & Market Behavior Explained
Understanding market trends is one of the most valuable skills a trader can develop. Professional traders don’t rely on luck or guesswork—they study price action, market behavior, and technical indicators to make informed decisions. By identifying trends early, traders can improve their chances of entering and exiting trades at the right time.
Whether you’re trading stocks, forex, commodities, or cryptocurrencies, recognizing the direction of the market is essential for consistent trading success.
What Is a Market Trend?
A market trend is the overall direction in which the price of an asset moves over a period of time.
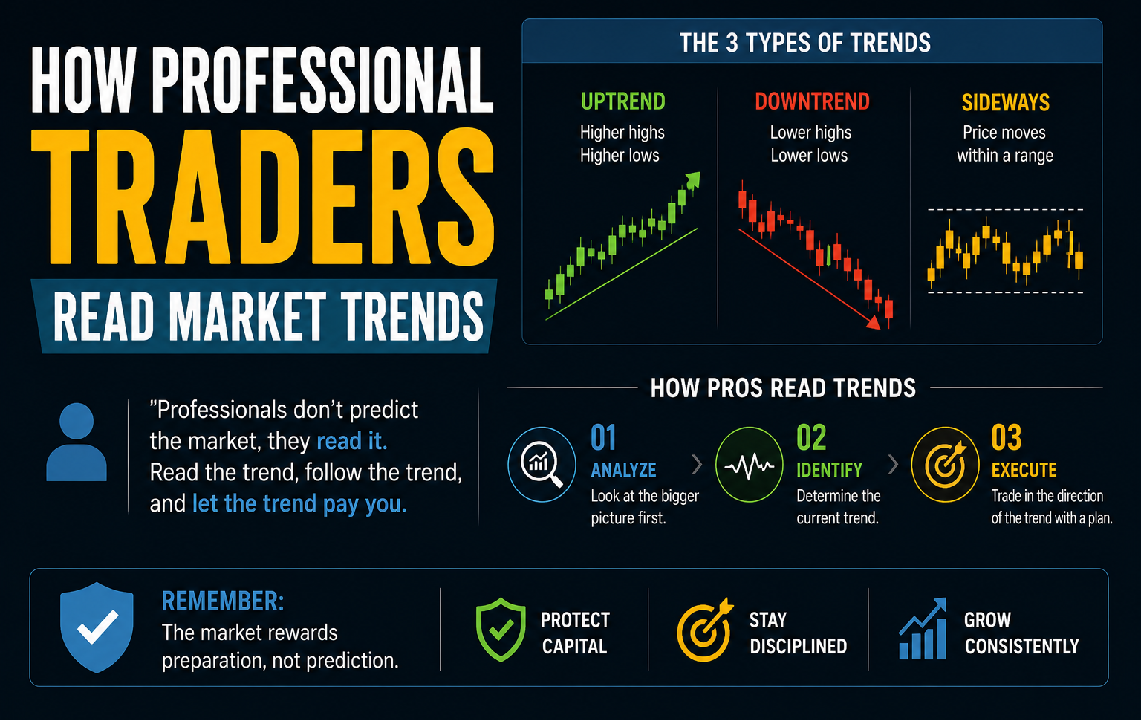
There are three main types of market trends:
1. Uptrend (Bullish Market)
An uptrend occurs when prices consistently make:
- Higher Highs (HH)
- Higher Lows (HL)
This indicates strong buying pressure.
Characteristics:
- Buyers dominate
- Positive market sentiment
- Price stays above key moving averages
- Pullbacks are generally buying opportunities
2. Downtrend (Bearish Market)
A downtrend forms when prices create:
- Lower Highs (LH)
- Lower Lows (LL)
This reflects strong selling pressure.
Characteristics:
- Sellers control the market
- Negative investor sentiment
- Price remains below major moving averages
- Rallies often provide selling opportunities
3. Sideways Trend (Range-Bound Market)
In a sideways market, prices move within a defined range without a clear direction.
Characteristics:
- Equal buying and selling pressure
- Low momentum
- Frequent reversals
- Common before major breakouts
Why Trend Analysis Is Important
Trading with the trend significantly improves the probability of success.
Benefits include:
- Higher probability trades
- Better entry and exit timing
- Reduced emotional decision-making
- Improved risk management
- Increased consistency over time
A common saying among experienced traders is:
“The trend is your friend until it bends.”
How Professional Traders Identify Trends
1. Study Price Action
Professional traders first observe price movement instead of relying solely on indicators.
They analyze:
- Higher highs and higher lows
- Lower highs and lower lows
- Strong breakout candles
- Market structure
Price action provides the clearest picture of buyer and seller behavior.
2. Use Moving Averages
Moving averages smooth price fluctuations and help identify trend direction.
Popular moving averages include:
- 20-Day Moving Average
- 50-Day Moving Average
- 100-Day Moving Average
- 200-Day Moving Average
Example
If price remains above the 200-day moving average:
- Long-term trend is bullish.
If price stays below:
- Long-term trend is bearish.
Moving averages should support—not replace—price analysis.
3. Identify Support and Resistance
Support is the price level where buying interest tends to increase.
Resistance is the price level where selling pressure often appears.
Professional traders monitor these levels to:
- Enter trades
- Set stop-losses
- Define profit targets
- Anticipate breakouts
4. Analyze Trading Volume
Volume reveals the strength behind a price move.
Rising Price + High Volume
Indicates strong buying interest.
Rising Price + Low Volume
May signal a weak or unsustainable trend.
Falling Price + High Volume
Suggests strong selling pressure.
Volume helps confirm whether a trend is genuine.
5. Observe Market Sentiment
Price is influenced by market psychology.
Professional traders monitor:
- Economic news
- Interest rate decisions
- Corporate earnings
- Global events
- Investor sentiment
Positive news can strengthen bullish trends, while negative events often accelerate bearish moves.
Understanding Market Behavior
Markets move because of supply and demand.
Professional traders recognize four common phases:
Phase 1: Accumulation
- Smart money begins buying.
- Prices move sideways.
- Public participation remains low.
This phase often precedes a new uptrend.
Phase 2: Markup
Demand increases.
Characteristics:
- Strong upward movement
- Increasing volume
- Positive news
- Growing investor confidence
This is where trend-following traders often participate.
Phase 3: Distribution
Professional investors begin taking profits.
Signs include:
- Slowing momentum
- High volatility
- Sideways price movement
- Increased selling near resistance
Phase 4: Markdown
Selling pressure dominates.
Characteristics:
- Lower highs
- Lower lows
- Negative sentiment
- Panic selling
Risk management becomes especially important during this phase.
Trend Confirmation Tools
Professional traders often combine multiple tools rather than relying on one indicator.
Common confirmation tools include:
- Moving Averages
- Relative Strength Index (RSI)
- MACD
- Trendlines
- Volume Analysis
- Candlestick Patterns
- Support & Resistance
Using several confirmations can reduce false trading signals.
Common Mistakes Beginners Make
Avoid these common errors:
- Trading against the trend
- Ignoring volume
- Chasing prices after sharp moves
- Entering without confirmation
- Confusing short-term pullbacks with trend reversals
- Overreacting to news
- Neglecting stop-loss placement
Discipline is often more important than predicting every market move.
Practical Tips for Reading Market Trends
- Start with higher timeframes to identify the primary trend.
- Use lower timeframes to refine entries.
- Wait for confirmation before entering a trade.
- Avoid emotional decisions during volatile markets.
- Follow a clear trading plan and manage risk consistently.
- Review past charts to improve pattern recognition.
Final Thoughts
Professional traders don’t try to predict every market movement—they focus on understanding trend direction, price structure, trading volume, and overall market behavior. By combining technical analysis with disciplined risk management, they make decisions based on probability rather than emotion.
Remember: Successful trading isn’t about catching every move. It’s about identifying high-probability trends, managing risk wisely, and staying consistent over the long term.