

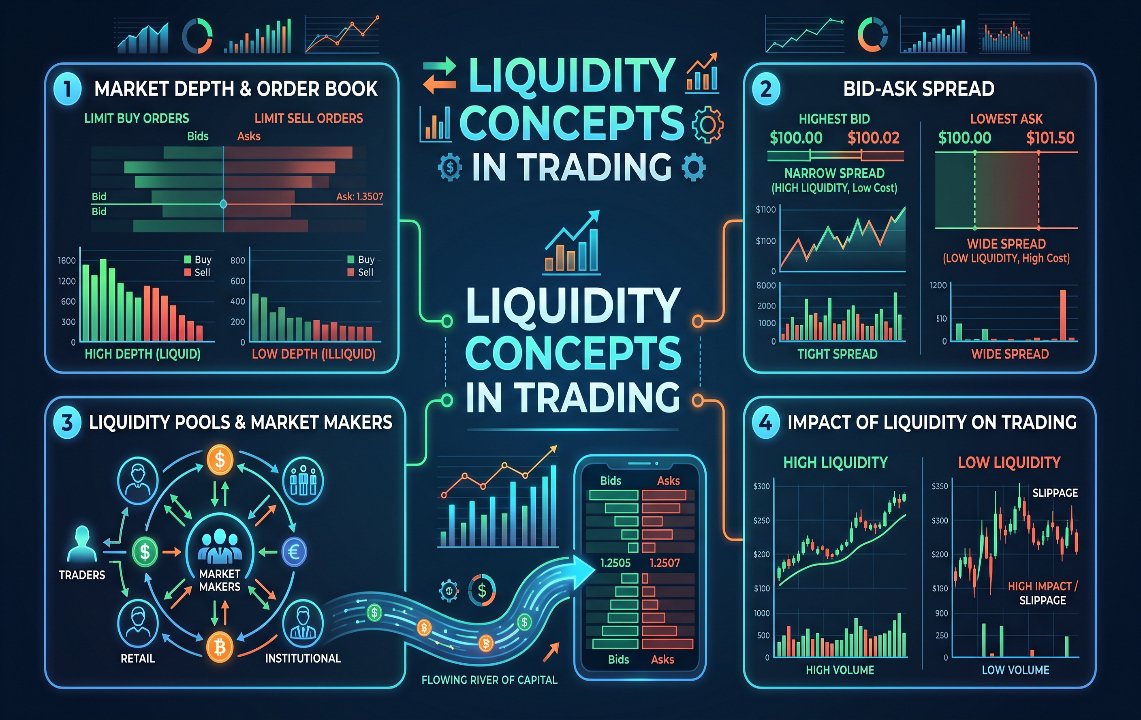
Liquidity is one of the most important concepts in financial markets. It helps traders understand how easily an asset can be bought or sold without causing a significant change in its price.
Whether you trade stocks, forex, futures, or cryptocurrencies, understanding liquidity can help you identify important market areas, improve trade execution, and better understand why price sometimes moves sharply.
What Is Liquidity in Trading?
In simple terms, liquidity refers to the availability of buyers and sellers in a market.
A highly liquid market has many participants and a large number of orders. This generally makes it easier to enter or exit a position with relatively little price impact.
For example, major currency pairs such as EUR/USD typically have substantial trading activity. In contrast, a thinly traded asset may have fewer buyers and sellers, making it harder to execute larger orders without affecting the price.
Simple Example
Imagine a stock trading at ₹500.
If thousands of buyers and sellers are active around ₹500, you may be able to buy or sell without moving the market significantly.
But if only a few participants are available, a large order could push the price noticeably higher or lower.
This difference is essentially a difference in market liquidity.
Why Does Liquidity Matter?
Liquidity matters for several reasons:
- It can affect trade execution.
- It influences bid-ask spreads.
- It can affect slippage.
- It helps traders understand market activity.
- It can influence how quickly price moves through certain areas.
- It is particularly important for short-term and high-frequency trading.
For traders, liquidity isn’t simply about whether an asset can be traded. It is also about how efficiently the trade can be executed.
Types of Liquidity
1. Buy-Side Liquidity
Buy-side liquidity generally refers to areas where buy orders or stop-loss orders from short sellers may be concentrated.
A common example is the area above a significant previous high.
If many traders have placed stop-loss orders above that high, a move through the level can trigger those orders and create additional buying activity.
2. Sell-Side Liquidity
Sell-side liquidity is commonly associated with areas below important lows.
For example, traders holding long positions may place stop-loss orders below a previous swing low.
If price moves below that level, those stops can be triggered, potentially increasing selling activity.
3. Resting Liquidity
Resting liquidity refers to orders waiting in the market, such as limit buy and limit sell orders.
These orders can contribute to market depth and may influence how price behaves when it reaches a particular level.
However, traders should remember that visible orders can be canceled or modified.
Liquidity Pools
A liquidity pool is an area where a relatively large concentration of orders may exist.
Common locations include:
- Previous swing highs
- Previous swing lows
- Equal highs
- Equal lows
- Major support levels
- Major resistance levels
- Areas with significant trading activity
Many price-action traders monitor these areas because concentrated orders can create opportunities for increased market activity.
What Is a Liquidity Sweep?
A liquidity sweep occurs when price moves into an area where traders expect liquidity to be located and triggers orders before reversing or continuing in another direction.
For example:
- A stock forms a clear previous high.
- Traders place stop-loss orders above that high.
- Price moves above the previous high.
- Stop orders are triggered.
- Price then reverses sharply.
This type of movement is often called a liquidity sweep or stop run.
A sweep does not automatically mean that a reversal will happen. Traders need additional confirmation from price structure, volume, order flow, or other analysis.
Liquidity and Stop-Loss Orders
Stop-loss orders are an important part of liquidity analysis.
Suppose many traders buy an asset around ₹1,000 and place their stop-loss orders near ₹980.
The ₹980 area may contain a concentration of potential sell orders.
If price falls toward that level, triggered stops can contribute to additional selling pressure.
This is one reason markets can sometimes move rapidly through obvious highs and lows.
Liquidity and Market Structure
Liquidity becomes more useful when combined with market structure.
Consider a market that has been making higher highs and higher lows.
If price approaches a previous high, traders may watch for one of two possibilities:
Scenario A: Breakout
Price moves above the high and continues upward, indicating continued buying interest.
Scenario B: Liquidity Sweep
Price briefly moves above the high, triggers orders, then falls back below the level.
The difference between the two is important because simply seeing price break a previous high doesn’t guarantee a sustainable breakout.
Liquidity vs Volume
Liquidity and volume are related but not identical.
Volume measures how much trading activity has occurred.
Liquidity describes how easily trades can be executed with limited price impact.
A market can have high volume but temporarily experience reduced liquidity, particularly during volatile conditions.
Understanding this distinction can help traders avoid confusing trading activity with available market depth.
Liquidity and the Bid-Ask Spread
The bid-ask spread is another important liquidity indicator.
- Bid: The highest price buyers are currently willing to pay.
- Ask: The lowest price sellers are currently willing to accept.
- Spread: The difference between the bid and ask.
Highly liquid markets often have tighter spreads because many buyers and sellers are competing for execution.
Less liquid markets can have wider spreads, increasing the potential cost of entering or exiting a trade.
Liquidity and Slippage
Slippage occurs when a trade is executed at a different price than expected.
It can become more noticeable when:
- Liquidity is low.
- Market volatility is high.
- Large orders are placed.
- Important economic announcements occur.
- Price moves extremely quickly.
Understanding liquidity can therefore help traders anticipate situations where execution may be less favorable.
How Traders Use Liquidity Concepts
Liquidity can be incorporated into a trading plan in several ways.
Identify Important Highs and Lows
Mark previous swing highs and lows on the chart. These areas can become important reference points.
Watch Equal Highs and Lows
Repeated highs or lows can attract attention because traders may place stops around these obvious levels.
Look for Reactions
When price reaches a potential liquidity area, observe what happens next rather than automatically entering a trade.
Combine Liquidity With Confirmation
Liquidity analysis can be combined with:
- Market structure
- Volume
- Order flow
- Candlestick behavior
- Support and resistance
- Trend analysis
This can help reduce reliance on a single signal.
Common Liquidity Trading Mistakes
Mistake 1: Assuming Every Sweep Will Reverse
A liquidity sweep can be followed by continuation rather than a reversal.
Mistake 2: Treating Liquidity as a Guaranteed Target
Liquidity zones are areas of potential interest, not guaranteed price destinations.
Mistake 3: Ignoring Risk Management
Even a well-planned liquidity setup can fail.
Mistake 4: Using Too Many Concepts at Once
Beginners sometimes combine liquidity, order blocks, fair value gaps, indicators, and multiple strategies without understanding the underlying market structure.
It’s generally better to master the basics first.
A Simple Liquidity-Based Trading Framework
A beginner-friendly framework could look like this:
1. Identify market structure
Determine whether the market is trending or ranging.
2. Mark important highs and lows
Look for obvious areas where orders may be concentrated.
3. Identify potential liquidity
Pay attention to equal highs, equal lows, previous swing points, and major levels.
4. Wait for price to reach the area
Avoid entering simply because a liquidity zone exists.
5. Look for confirmation
Study price behavior, volume, order flow, or market structure after the level is reached.
6. Define risk before entering
Determine the stop-loss and position size according to your risk tolerance.
Final Thoughts
Liquidity is a fundamental concept that can help traders understand where market activity may be concentrated and why price can move sharply around certain levels.
By studying buy-side liquidity, sell-side liquidity, liquidity pools, stop orders, spreads, and slippage, traders can develop a deeper understanding of market behavior.
However, liquidity concepts should not be treated as a standalone prediction system. Markets can behave unpredictably, and liquidity levels can change rapidly.
The strongest approach is to combine liquidity analysis with market structure, disciplined risk management, and a clearly tested trading strategy.