

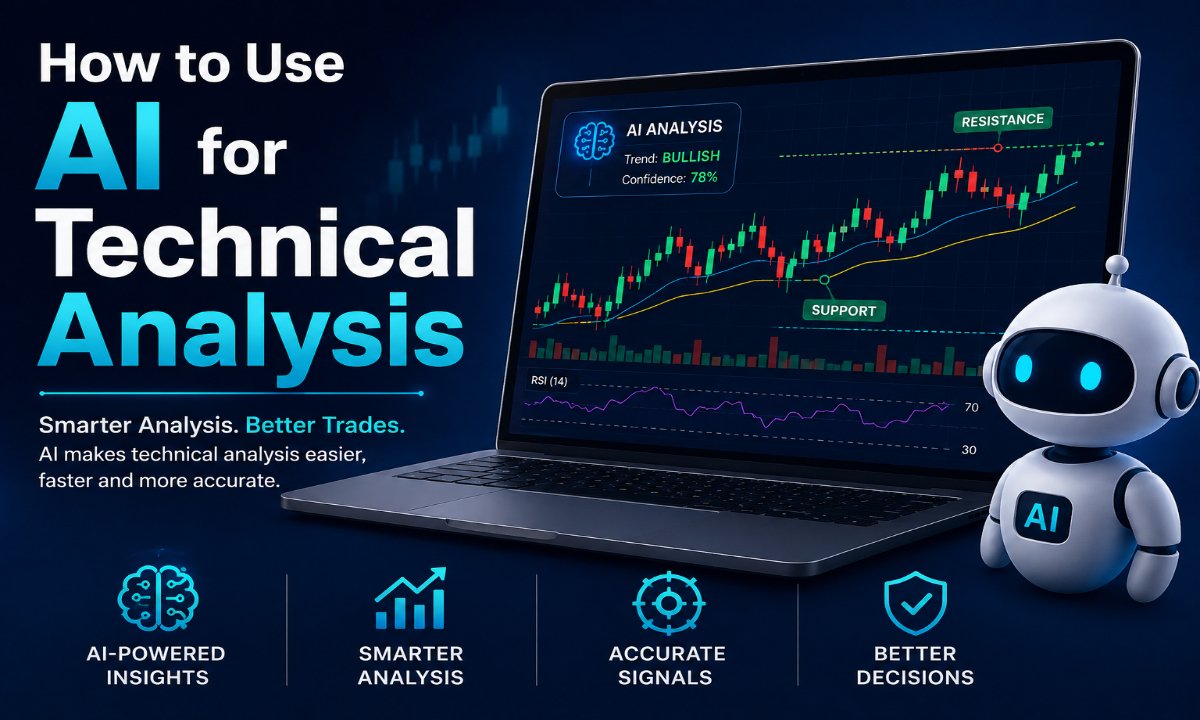
Technical analysis has always been an important part of trading. Traders study price charts, trading volume, and technical indicators to identify market trends and potential trading opportunities.
Today, Artificial Intelligence (AI) is making technical analysis faster and more accessible. AI tools can analyze large amounts of market data, identify patterns, summarize indicators, and help traders evaluate potential setups.
But AI is not a crystal ball. It can support technical analysis, but it cannot guarantee profitable trades.
What Is AI-Powered Technical Analysis?
AI-powered technical analysis uses artificial intelligence and machine learning to analyze market data and identify potential patterns or trends.
Traditional technical analysis often requires traders to manually examine charts and indicators. AI can automate or assist with some of this process.
AI tools can analyze:
- Price movements
- Trading volume
- Market trends
- Moving averages
- RSI and MACD
- Support and resistance
- Chart patterns
- Market volatility
- Historical price data
The goal is to help traders make more informed decisions using data rather than relying only on emotions or intuition.
How Can AI Help With Technical Analysis?
1. Identify Market Trends
AI can analyze historical and current price data to identify possible bullish, bearish, or sideways market conditions.
For example, an AI system may analyze moving averages and price momentum to determine whether an asset is showing signs of an upward or downward trend.
However, traders should confirm AI-generated observations using their own analysis.
2. Analyze Technical Indicators
AI can help interpret commonly used technical indicators such as:
- Moving Average
- RSI
- MACD
- Bollinger Bands
- Stochastic Oscillator
- Average True Range (ATR)
Instead of manually interpreting every indicator, traders can use AI to summarize what multiple indicators are showing.
3. Find Support and Resistance Levels
Support and resistance are important concepts in technical analysis.
AI tools can analyze historical price movements to help identify areas where prices have previously reacted strongly.
These levels can then be used as part of a broader trading strategy.
4. Detect Chart Patterns
AI-powered tools can assist in recognizing patterns such as:
- Head and shoulders
- Double top
- Double bottom
- Triangles
- Flags
- Wedges
- Breakouts
Pattern recognition can be time-consuming when performed manually, especially when analyzing multiple stocks.
AI can help scan charts more efficiently.
Using AI to Analyze a Trading Chart
A simple AI-assisted technical analysis workflow could look like this:
Step 1: Select an Asset
Choose the stock, index, cryptocurrency, or other financial instrument you want to analyze.
Step 2: Select a Timeframe
Choose a timeframe based on your trading style.
For example:
- Intraday traders may analyze shorter timeframes.
- Swing traders may focus on hourly or daily charts.
- Long-term investors may use weekly or monthly charts.
Step 3: Add Technical Indicators
Use indicators that are relevant to your strategy rather than adding too many indicators.
For example, you might combine:
Moving Average + RSI + MACD + Volume
Step 4: Ask AI to Interpret the Data
AI can help explain what the indicators are showing.
For example, you could ask:
“Analyze these technical indicators and explain whether the current market conditions appear bullish, bearish, or neutral.”
The output should be treated as analysis—not a guaranteed trading signal.
Step 5: Confirm the Setup
Do not immediately enter a trade based only on an AI-generated answer.
Check:
- Overall market trend
- Support and resistance
- Trading volume
- Price action
- News and major events
- Risk-to-reward ratio
Step 6: Apply Risk Management
Before entering a trade, determine how much capital you are willing to risk.
Consider using:
- Stop-loss levels
- Position sizing
- Risk-to-reward ratios
- Maximum daily or weekly loss limits
AI and Common Technical Indicators
Moving Averages
Moving averages help traders identify the general direction of a trend.
AI can compare different moving averages and analyze relationships between price and moving-average levels.
RSI
The Relative Strength Index measures price momentum and is commonly used to identify potentially overbought or oversold conditions.
AI can help explain RSI readings alongside other market information.
MACD
MACD is commonly used to analyze momentum and trend changes.
AI can help identify potential crossovers and explain what they could mean within the broader market context.
Bollinger Bands
Bollinger Bands can help traders analyze volatility and price positioning.
AI can assist in identifying situations where price moves toward or beyond the bands, although such movements should not automatically be interpreted as buy or sell signals.
Trading Volume
Volume can provide additional context for price movements.
AI can analyze changes in volume and compare them with historical activity to identify unusual market behavior.
Using AI for Multiple-Timeframe Analysis
One powerful approach is to analyze multiple timeframes.
For example:
Weekly Chart → Daily Chart → 1-Hour Chart
The weekly chart can provide the broader trend.
The daily chart can help identify the intermediate setup.
The 1-hour chart can help with more precise entry and exit planning.
AI can help summarize these different timeframes, but traders should understand the underlying charts before making decisions.
Example of an AI Technical Analysis Prompt
You can use a structured prompt such as:
“Analyze this stock using technical analysis. Review the current trend, support and resistance levels, moving averages, RSI, MACD, volume, and price action. Explain the bullish and bearish scenarios, key risks, and what additional information should be checked before making a trading decision.”
Providing structured information usually produces more useful analysis than simply asking:
“Should I buy this stock?”
Benefits of AI for Technical Analysis
Faster Analysis
AI can process multiple indicators and large amounts of market information quickly.
Pattern Recognition
AI can assist in identifying recurring patterns in historical data.
Better Organization
AI can summarize technical information into a more understandable format.
Reduced Emotional Bias
Using predefined analytical criteria can help reduce decisions based purely on fear or excitement.
Educational Support
Beginners can ask AI to explain technical indicators and trading concepts in simple language.
Limitations of AI Technical Analysis
AI has important limitations.
No Guaranteed Predictions
AI cannot predict future prices with certainty.
Historical Data Is Not the Future
A pattern that worked in the past may not work under different market conditions.
Poor Data Can Produce Poor Analysis
Incorrect, delayed, or incomplete market data can lead to misleading conclusions.
Overfitting
A model may perform extremely well on historical data but fail when exposed to new market conditions.
Unexpected Events
News, economic announcements, geopolitical events, and company-specific developments can cause sudden price movements that technical models may not anticipate.
AI vs Human Technical Analysis
AI and human traders have different strengths.
| AI | Human |
|---|---|
| Processes large datasets quickly | Understands broader context |
| Detects statistical patterns | Applies judgment |
| Can analyze multiple assets | Understands personal risk tolerance |
| Does not experience emotions | Can interpret unexpected situations |
| Can automate repetitive analysis | Can question model assumptions |
The strongest approach can be a combination of both.
AI can analyze the data. Humans can evaluate the context and risk.
Best Practices for Using AI in Technical Analysis
To use AI responsibly:
- Use reliable market data.
- Do not depend on a single indicator.
- Confirm AI-generated analysis manually.
- Backtest strategies before using real money.
- Use proper position sizing and stop-loss rules.
- Avoid blindly following AI-generated buy or sell signals.
- Keep a trading journal to evaluate your decisions.
- Continuously learn about technical analysis and market behavior.
Conclusion
AI is becoming a valuable assistant for technical analysis. It can help traders analyze indicators, identify patterns, scan markets, summarize chart information, and organize large amounts of data.
However, AI should not be treated as a guaranteed trading system.
The best approach is to combine AI + Technical Analysis + Market Research + Risk Management.
When used correctly, AI can make technical analysis faster and more efficient while helping traders make decisions based on structured information rather than emotions alone.
AI can improve your analysis—but successful trading still requires knowledge, discipline, and risk management.