

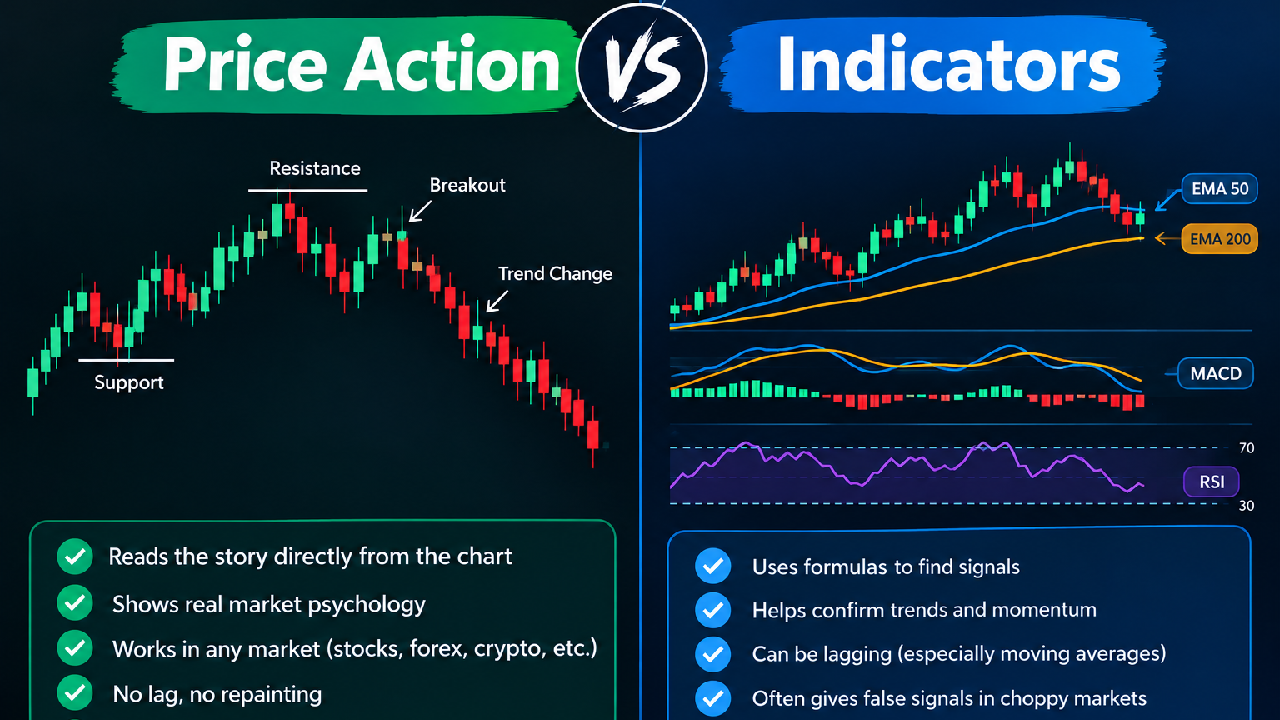
When it comes to trading, two popular approaches are Price Action and Technical Indicators. Both are widely used by traders to analyze charts, identify potential opportunities, and manage risk.
But what is the difference between them? And should traders rely on price action, indicators, or a combination of both?
Let’s understand them in simple terms.
What Is Price Action?
Price Action means analyzing the movement of an asset’s price directly from the chart without relying heavily on technical indicators.
Traders study things such as:
- Support and resistance
- Market trends
- Candlestick patterns
- Breakouts and breakdowns
- Higher highs and higher lows
- Lower highs and lower lows
- Supply and demand zones
- Market structure
For example, if a stock repeatedly finds buying interest around a particular price level, a price-action trader may identify that area as support and watch how the price behaves when it reaches the level again.
Advantages of Price Action
1. Direct Market Information
Price action focuses on what the market is actually doing rather than relying on calculations derived from previous price data.
2. Cleaner Charts
Traders can analyze charts without adding multiple indicators, making the chart easier to read.
3. Useful Across Markets
Price-action concepts can be applied to stocks, indices, forex, commodities, and cryptocurrencies.
4. Helps Understand Market Structure
Studying price movements can help traders recognize trends, consolidation, breakouts, and changes in momentum.
What Are Technical Indicators?
Technical indicators are mathematical calculations based on market data such as price, volume, and time. They are designed to help traders interpret market conditions.
Popular indicators include:
- Moving Averages
- RSI (Relative Strength Index)
- MACD
- Bollinger Bands
- Stochastic Oscillator
- VWAP
- Average True Range (ATR)
For example, a moving average can help traders identify the general direction of a trend, while RSI is commonly used to study momentum and overbought or oversold conditions.
Advantages of Indicators
1. Simplifies Analysis
Indicators can turn complex price data into easy-to-understand visual signals.
2. Helps Identify Trends
Moving averages and other trend-following indicators can help traders understand the broader direction of the market.
3. Supports Momentum Analysis
Indicators such as RSI and MACD can provide additional information about momentum.
4. Can Create Trading Rules
Indicators can be incorporated into systematic trading strategies with predefined entry and exit conditions.
Price Action vs Indicators
| Feature | Price Action | Technical Indicators |
|---|---|---|
| Main focus | Raw price movement | Calculated market data |
| Chart appearance | Usually cleaner | May require multiple tools |
| Market structure | Strong focus | Usually secondary |
| Trend analysis | Based on price movement | Often based on formulas |
| Signals | Requires interpretation | Can provide defined signals |
| Learning curve | Requires chart-reading practice | Depends on the indicator |
| Best use | Understanding market behavior | Supporting analysis |
Are Indicators Always Accurate?
No technical indicator can predict the future with certainty.
Indicators are generally based on historical market data, which means their signals can sometimes appear after a significant price movement has already occurred.
For example, a moving-average crossover may confirm a trend only after the price has already moved. Similarly, an RSI reading can remain overbought or oversold while the price continues moving in the same direction.
This is why indicators are better viewed as analysis tools rather than prediction machines.
Can Price Action Be Wrong?
Yes.
Price-action analysis also involves uncertainty. A support level can break, a breakout can fail, and a seemingly strong candlestick pattern can be followed by an unexpected move.
Markets are influenced by many factors, including:
- Economic data
- Company news
- Global events
- Market sentiment
- Liquidity
- Institutional activity
Therefore, risk management remains important regardless of the trading approach.
Can You Use Price Action and Indicators Together?
Absolutely.
Many traders combine both approaches instead of treating them as competing methods.
For example:
Price Action → Identify a support or resistance zone.
Market Structure → Determine whether the market is trending or consolidating.
Indicator → Use RSI, MACD, or a moving average as additional confirmation.
Risk Management → Define the potential entry, stop-loss, and position size.
This approach can provide multiple perspectives on the same market situation.
A Simple Example
Imagine a stock is moving upward and creating higher highs and higher lows.
A trader may identify the overall structure as an uptrend using price action.
The stock then pulls back toward an important support area. At the same time, the price remains above a commonly used moving average.
Instead of taking a trade solely because the moving average gives a signal, the trader can consider the price structure, support level, market momentum, and risk-reward setup together.
The indicator becomes a supporting tool rather than the entire trading strategy.
Which Approach Should Beginners Learn?
There is no universal method that works for every trader or every market condition.
Beginners can benefit from understanding basic price action and market structure first, because these concepts help explain what is happening on the chart.
After that, technical indicators can be introduced to understand additional aspects such as:
- Trend
- Momentum
- Volatility
- Volume
- Potential entry and exit conditions
The key is to avoid adding too many indicators simply because they are available.